


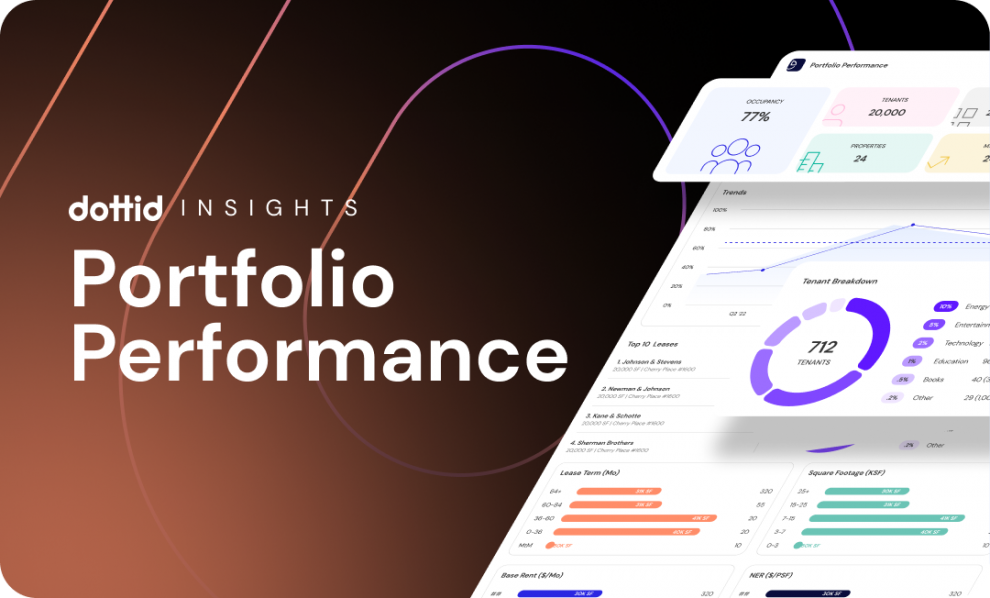
Proptech solution Dottid announced that it is now offering upgraded insights with the release of its holistic and customizable portfolio performance visualizer. Dottid users can now get a snapshot of potential risks, occupancy trends, target industries, important tenants and more for even smarter portfolio decision-making.
New upgrades include: an occupancy trends graph that shows the change in average occupancy over the last four quarters, a pie graph that breaks down the largest industries among active tenants, a list of the top 10 leases that have the largest square footage, four histograms that show how active tenants are distributed among lease term, lease area, base rent and net effective rent. This page also includes a a table with a breakdown of each property’s occupancy, weighted average lease term (WALT) and the percent change in WALT from the previous quarter. This page can be filtered by fund, sub-portfolios, properties or market to customize the scale of insights analysis.
“Portfolio performance is the real-time indicator for asset health and continues Dottid’s goal of providing detailed, actionable insights to our users.” said Kyle Waldrep, chief executive officer and founder of Dottid. “Simply, this dashboard allows property owners to make better decisions, faster.”
These new features help users identify high-performing and at-risk properties, the trend in average occupancy over the last year since joining Dottid, the most important tenants by square footage and industry exposure across portfolios. These features can also help users identify favorable terms for future tenants based on the current base rent, NER, lease, area and term trends for active tenants.