




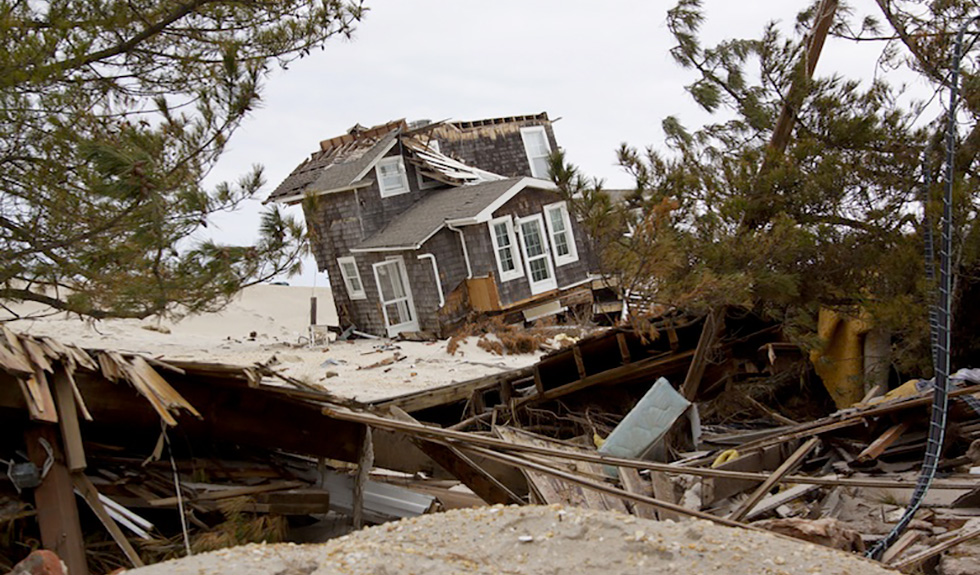
With the devastation brought by Hurricane Harvey and the damaging effects of Hurricane Irma, both of which are still being assessed by property owners, servicers, and investors alike, financial markets are showing a fair amount of turbulence in response. It is possible that the overall impact will not be significant once the situations settle and cleanup and rebuilding begin. However, it is also possible that the impact will be widespread and sustained for a longer period of time through the completion of rebuilding efforts as compared with previous disasters.
DBRS recently published a commentary on the weakened Houston commercial real estate (CRE) market shown through cash flow declines for properties securing commercial mortgage-backed security (CMBS) loans—particularly in the hotel and office sectors. With the additional stressor of Harvey, the Houston CRE market could be in a particularly tough situation given the existing challenges in a weakened economy resulting from a stagnant energy sector.
In this commentary, DBRS explores the historical effects of major U.S. disasters on CMBS performance. DBRS examined the default rate and associated losses during the periods following Hurricane Katrina, which hit New Orleans in 2005, and Superstorm Sandy, which hit the upper Atlantic coast in 2012. Based on the data pulled, there was a relatively limited impact on the performance of loans secured by properties in Sandy’s path, but a significant increase in delinquency and default rates for those properties securing debt in Katrina’s path.
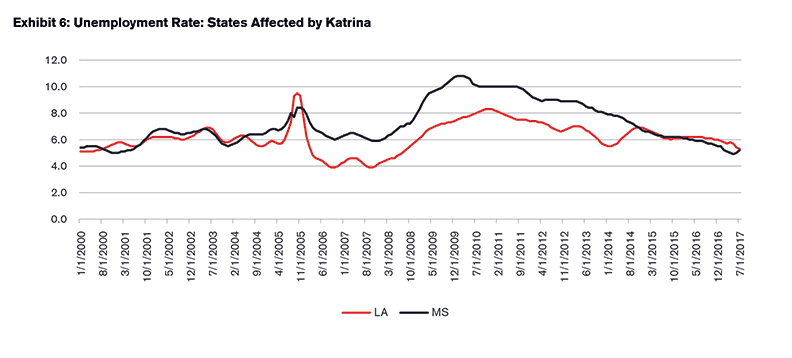
DBRS looked further into the economic performance of the affected states during the respective periods following those storms and found that the unemployment rate spiked in states affected by Katrina but remained flat in states affected by Sandy. Such findings match DBRS’s view that macroeconomic factors, particularly unemployment, are the most important indicators for CMBS performance.
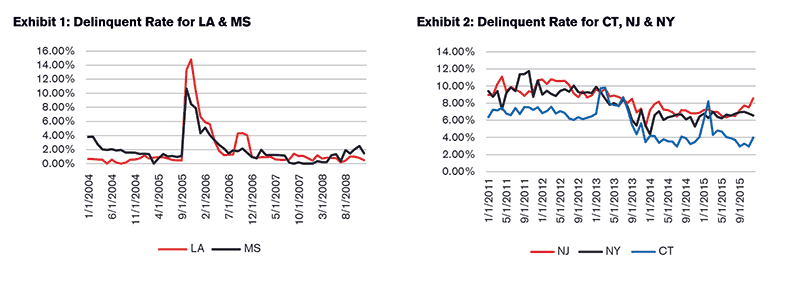
DBRS chose the two states most affected by Katrina—Louisiana and Mississippi—and the three states most affected by Sandy— Connecticut, New Jersey, and New York—to analyze. Exhibits 1 and 2 clearly show the delinquency rates spiking in Louisiana and Mississippi at the end of 2005. On the other hand, only Connecticut had delinquency rate increases, whereas rates in New Jersey and New York were actually trending down in 2012 following Sandy.
DBRS speculated that some of the delinquency increases may have been caused by the short-term chaos in the respective areas following hurricane activity; as such, DBRS looked further into the years following the storms to identify loans that eventually transferred to special servicing and loans that ultimately took a loss. The specially serviced rate was much lower than the delinquent rate in Louisiana and Mississippi in the years following Katrina, as shown in Exhibits 3 and 4. While the specially serviced rate spiked much higher compared with historical figures in Louisiana and Mississippi, the percentage of loans specially serviced in New Jersey and New York actually fell in those years.
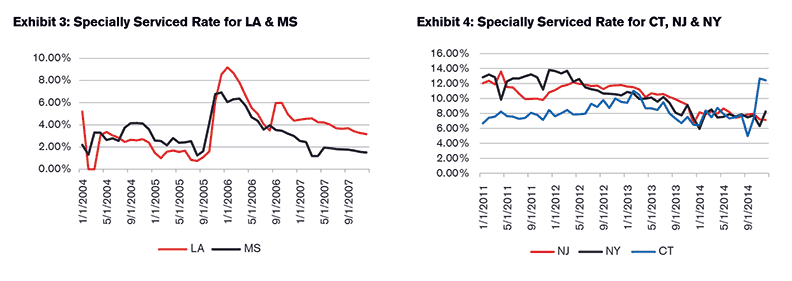
Between August 2005 and December 2006, 42 loans transferred to the special servicer in Louisiana, which got the worst of Katrina’s impact. Of those 42 loans, 20 were liquidated with an average loss severity of 18.34 percent. Eight of those 20 loans liquidated had significant losses, with an average loss severity of 44.85 percent.
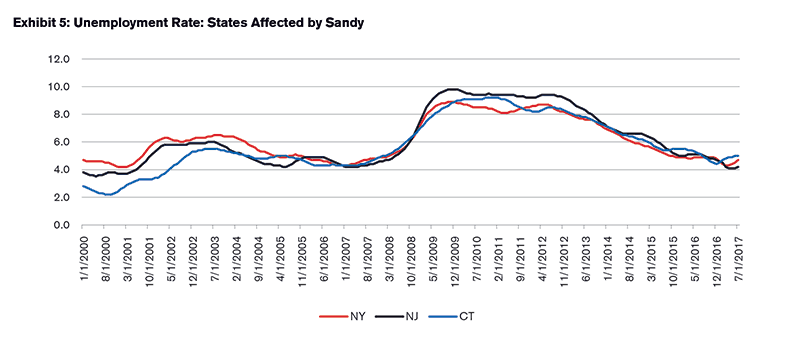
DBRS believes there are multiple factors contributing to the difference in impact to CMBS performance for the two disasters. For example, the sheer difference in costs (Sandy reportedly caused approximately $75 billion in damage, whereas Katrina’s costs were estimated to be in excess of $100 billion); superior infrastructure and higher population density in the areas affected by Sandy compared to the higher volume of tertiary and rural communities affected by Katrina. Historical unemployment is another driver for the affected states in the years following the storms. As expected, the unemployment rate follows a similar pattern to the delinquency and specially serviced rate models: Louisiana and Mississippi showed an unemployment rate increase during Katrina and in the few months before the delinquency. Special servicing rates also spiked in those states. Between August 2005 and October 2005, unemployment in Louisiana increased by more than 2.0 percent and between October 2005 and January 2006, the specially serviced rate increased from 1.6 percent to 9.2 percent. For Sandy, there was no tangible increase in unemployment nor spike in delinquency or specially serviced rates for CMBS loans in the affected states during the months following the storm.




Add Comment