
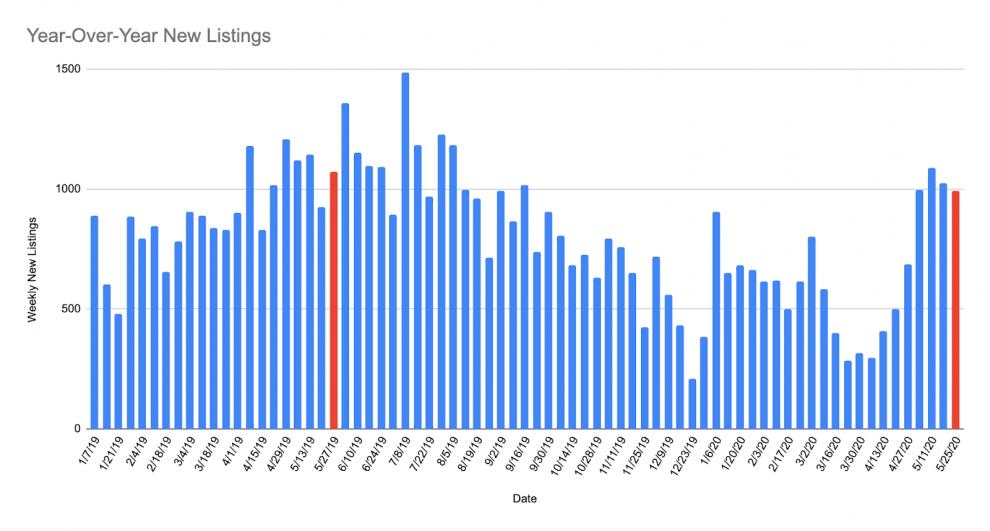
Rental Market Activity Update During the week of May 25th-May 31st, 2020, new Manhattan rental listings continued to arrive at seasonal levels while leases signed remained far below typical levels. The 992 new listings that came to market during the week represents a decrease of 8% from the previous year and 5% fewer than last week. In terms of market activity, listings appear to be back to normal.
On the tenant side, the 14% tick up in leases signed from 323 last week to 367 this week suggests renters are slowly but steadily returning to the market as possibilities for viewing and moving expand. As noted in a separate report, prospective renters in today’s market are also seeing improved pricing, with all but a few sub-neighborhoods in the city showing average price change reductions. This should lead to a significant rebound in leases signed once landlords, agents, and renters are given the all-clear to resume in-person showings later this month.
Year-Over-Year Summary of 4th Week of May (May 25-May 31) market activity:
● New Rental Listings: 992 (a decrease of 8% compared to 1,073 in 2019)
● Lease Signed: 367 (a decrease of 59% compared to 890 in 2019)
● Off-Market: 139 (a decrease of 32% compared to 205 in 2019)
Week-to-Week Comparing the 3rd Week of May 2020 to the 4th Week of May 2020’s market activity:
● New Rental Listings: 992 (a decrease of 5% compared to 1,045 the week before)
● Lease Signed: 367 (an increase of 14% compared to 323 the week before)
● Off-Market: 139 (an increase of 5% compared to 132 the week before)
Rentals Data source: RLS. Monday to Sunday defines a “week” of data. May 25-May 31 is the 4th Week of May.
YEAR-OVER-YEAR NEW LISTINGS
The two red bars are the 2 values displayed under each chart: 4th Week May in 2019 and 4th Week May in 2020.
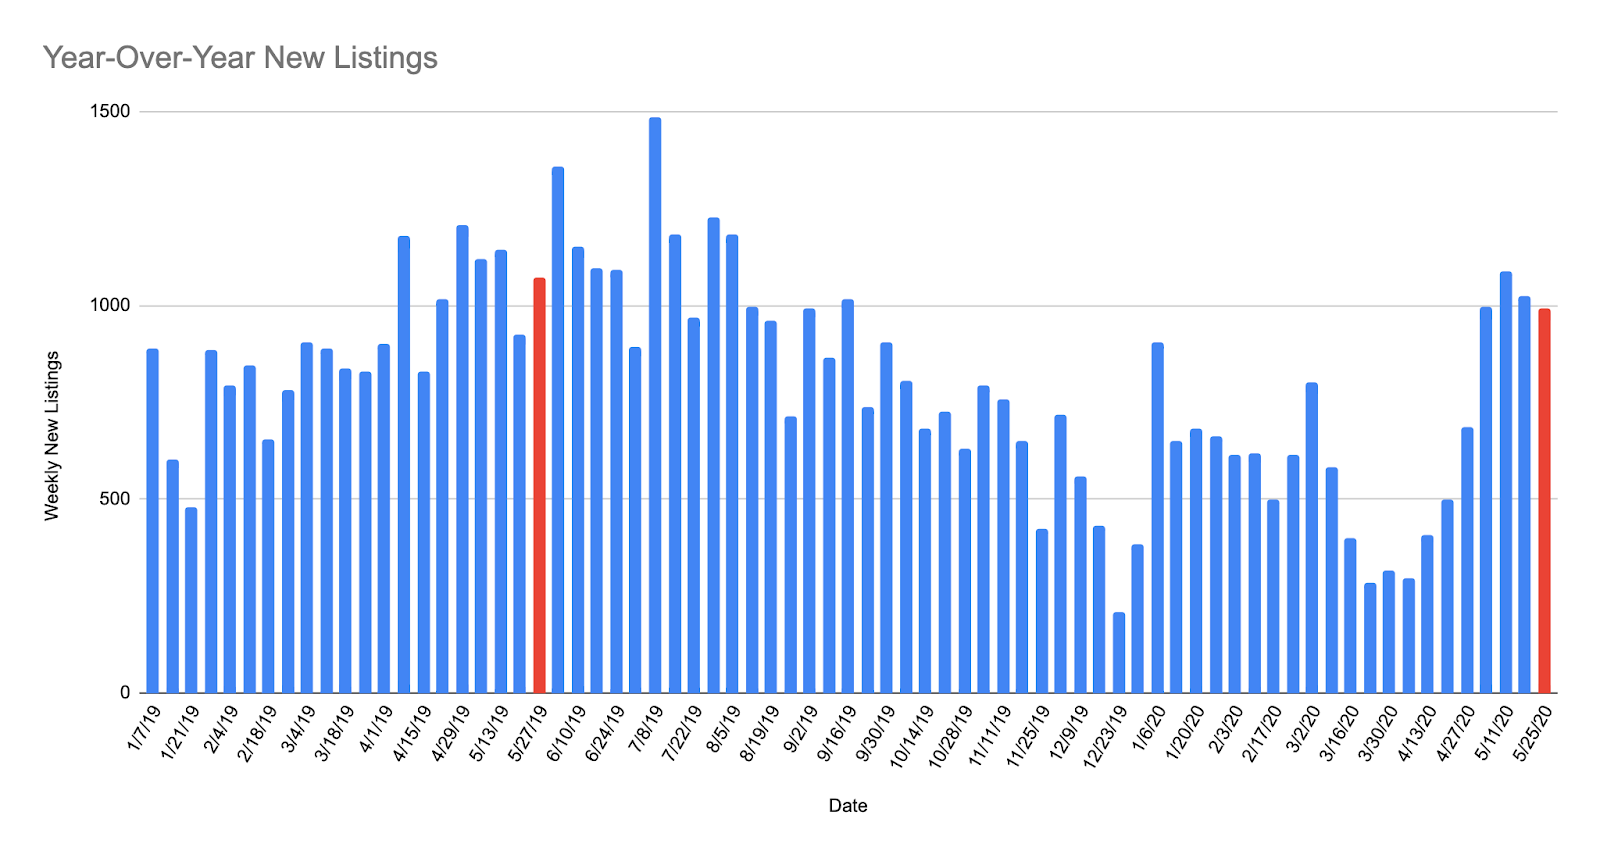
New Listings During the 4th Week of May: 2019: 1,073 2020: 992 (-8%)
YEAR-OVER-YEAR NEW LEASE SIGNED/RENTED
The two red bars are the 2 values displayed under each chart: 4th Week May in 2019 and 4th Week May in 2020.
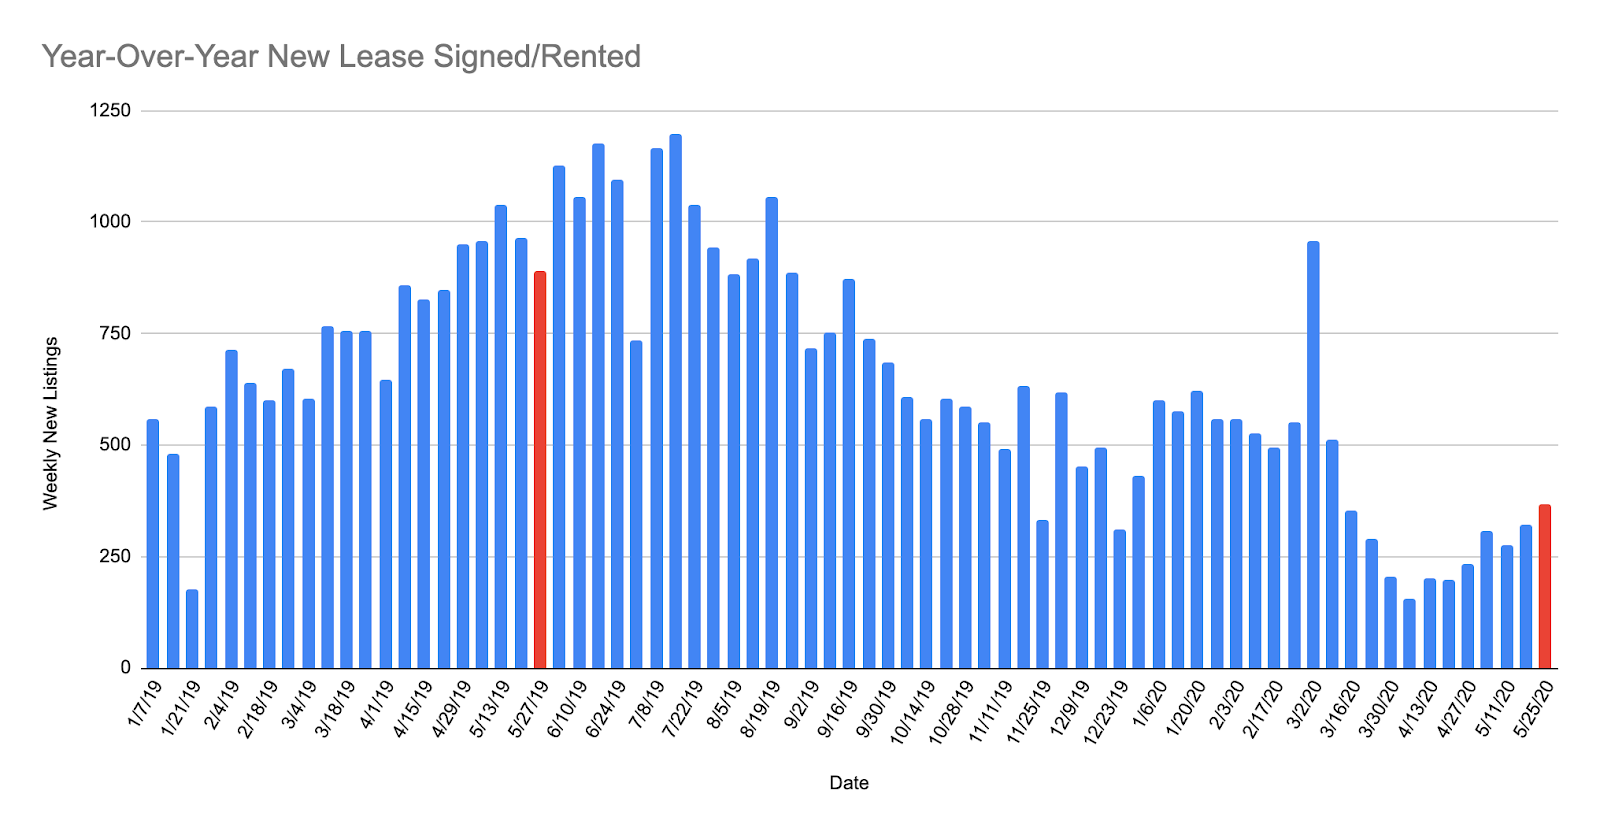
Lease Signed During the 4th Week of May: 2019: 890 2020: 367 (-59%)
YEAR-OVER-YEAR OFF MARKET RENTALS
The two red bars are the 2 values displayed under each chart: 4th Week May in 2019 and 4th Week May in 2020..
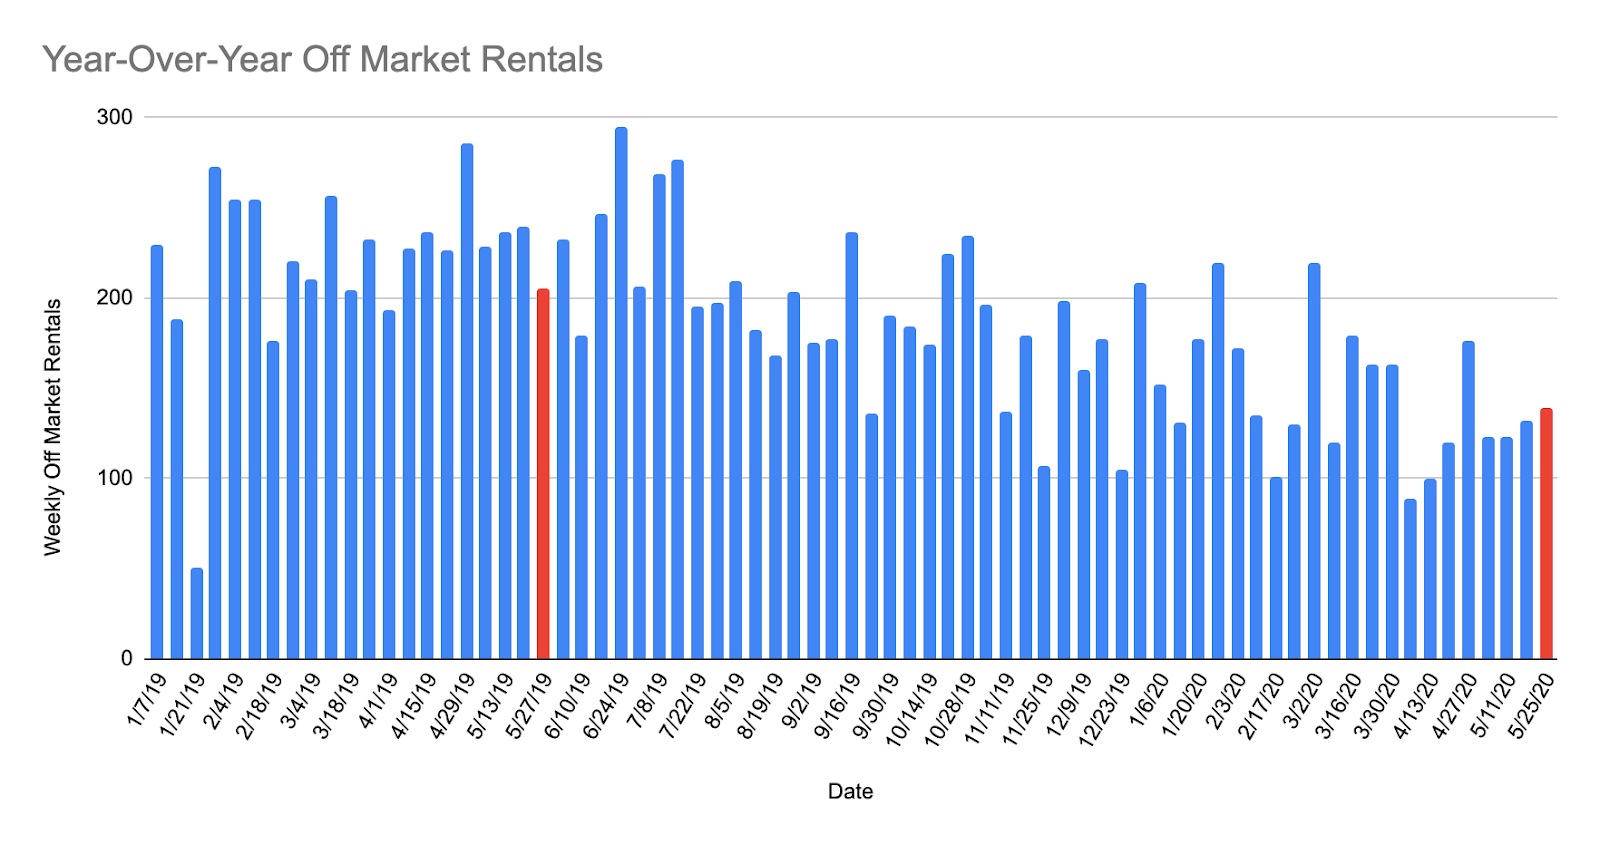
Listings Removed During the 4th Week of May: 2019: 205 2020: 139 (-32%)