
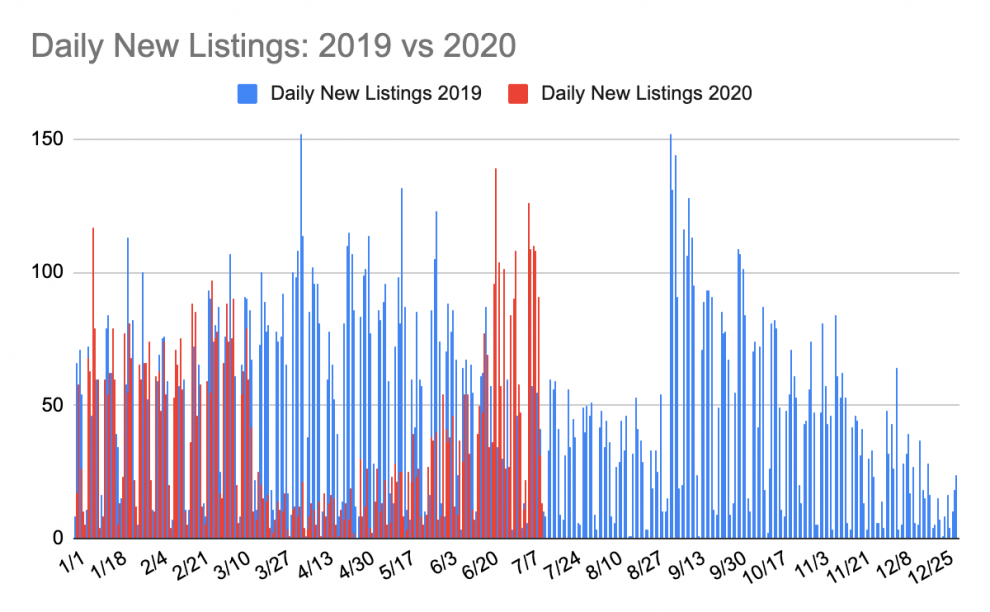
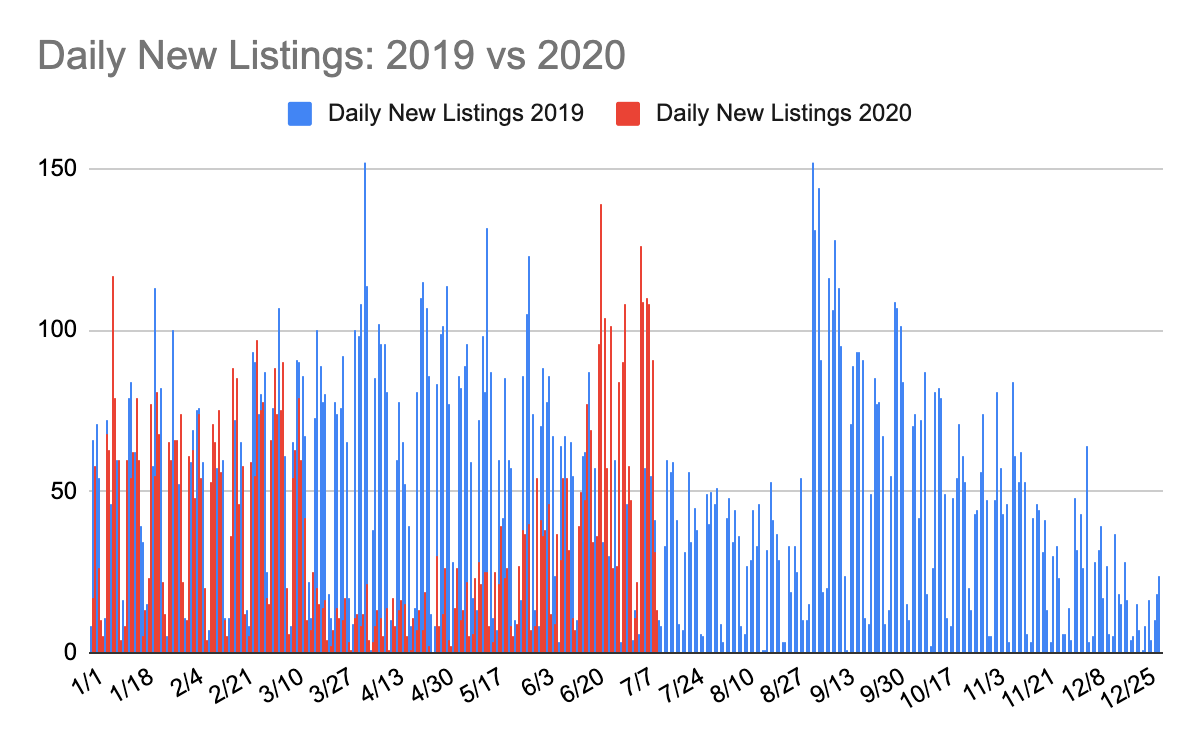
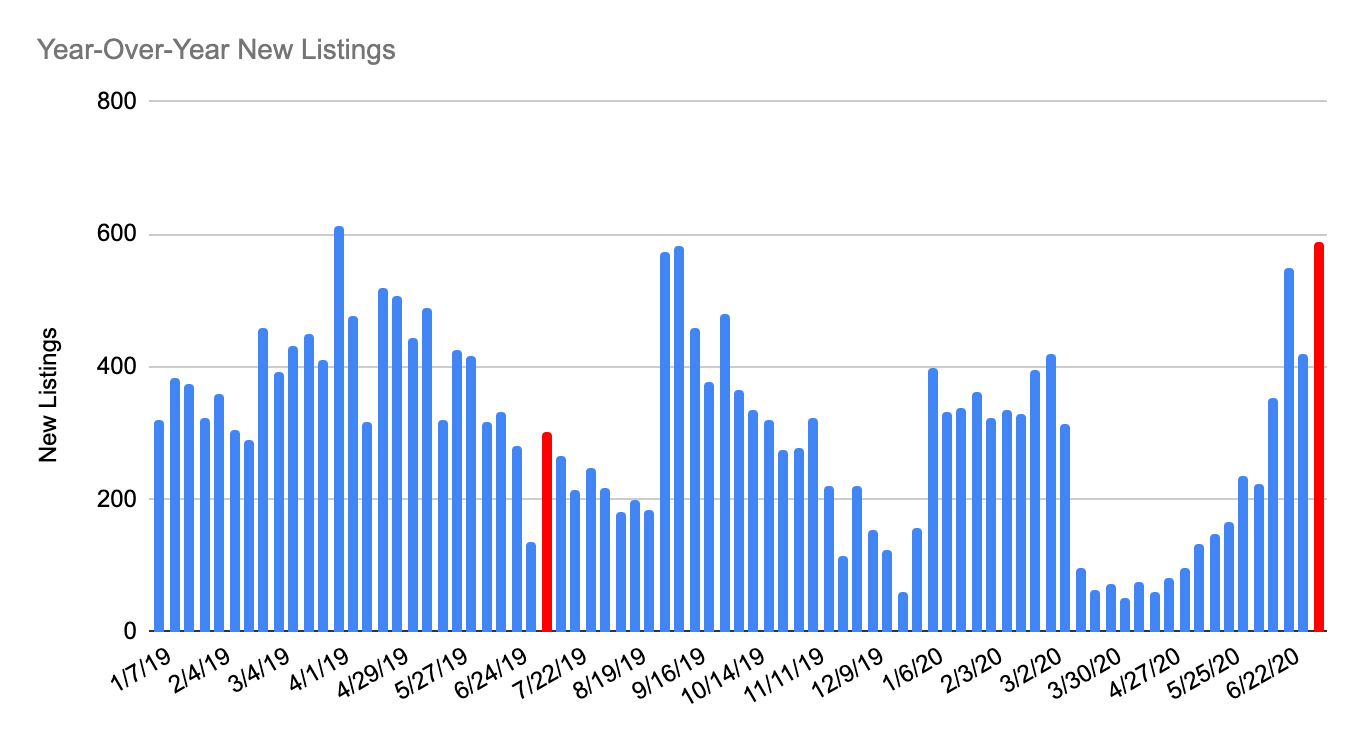
The inventory for Manhattan homes continued to increase at a brisk pace after a holiday-shortened week. During the second week of July, 558 new listings arrived on the market. This is the largest increase in new listings in 2020 and the most since the height of last year’s busy season in April 2019. Moreover, this number nearly doubles the number of new listings seen during a typically slow summer market week.
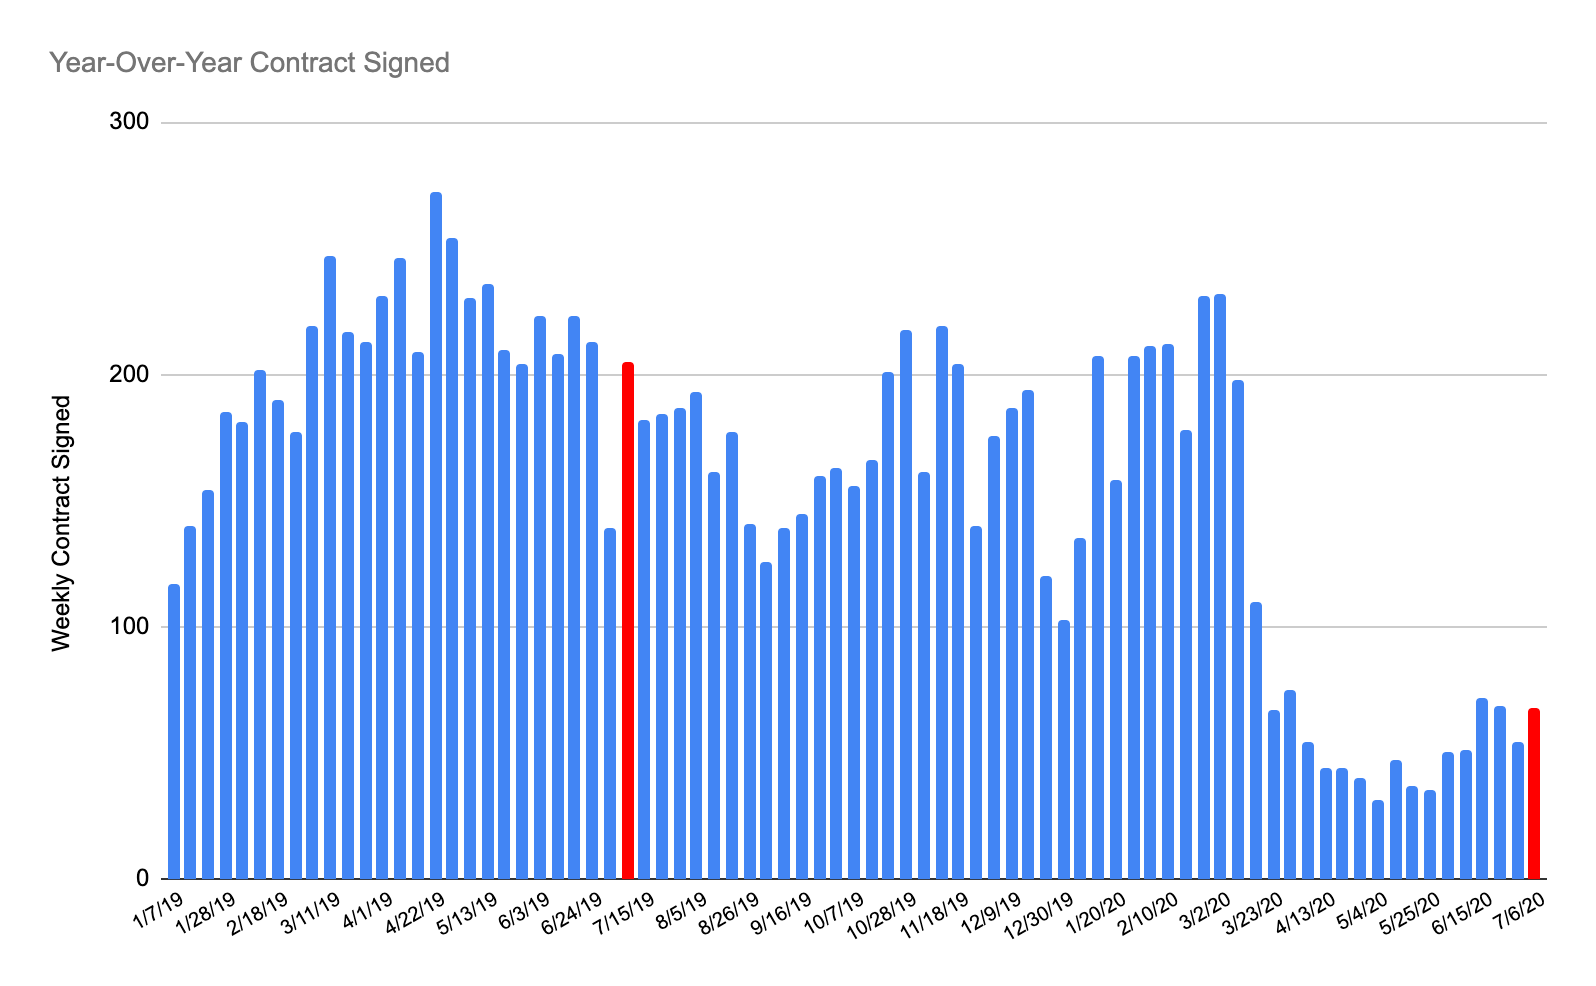
Contract activity, which typically lags new listing activity, remained at steady, if depressed levels throughout the week, with 68 deals reported. This is 14 more than last week’s holiday-shortened number, but 66% below 2019’s 213 deals during the same week, which incidentally was part of the aforementioned slow summer market. As the reopening progresses, and buyers have a chance to manage the logistics needed for purchase, the number of contracts signed will likely increase. However, the extent of returning demand remains at worrisome levels and hints that price corrections may be following in the short term.
The number of listings taken off the market remains at what would normally be considered typical levels for the active season. This is to be expected as sellers try for sales during the first weeks of reopening.
Year-over-Year Summary of 2nd Week of July 2020 (Monday 7/06/20 – Sunday 7/12/20) market activity:
• New Listings: 588 (an increase of 93% compared to 301 in 2019)
• Contracts Signed: 68 (a decline of 66% compared to 205 in 2019)
• Taken Off Market: 133 (a decrease of 39% compared to 219 in 2019)
Year-Over-Year New Listings for the 2nd Week of July:
2019: 301
2020: 588 (+93%)
Year-Over-Year Contracts Signed for the 2nd Week of July:
2019: 205
2020: 68 (66%)
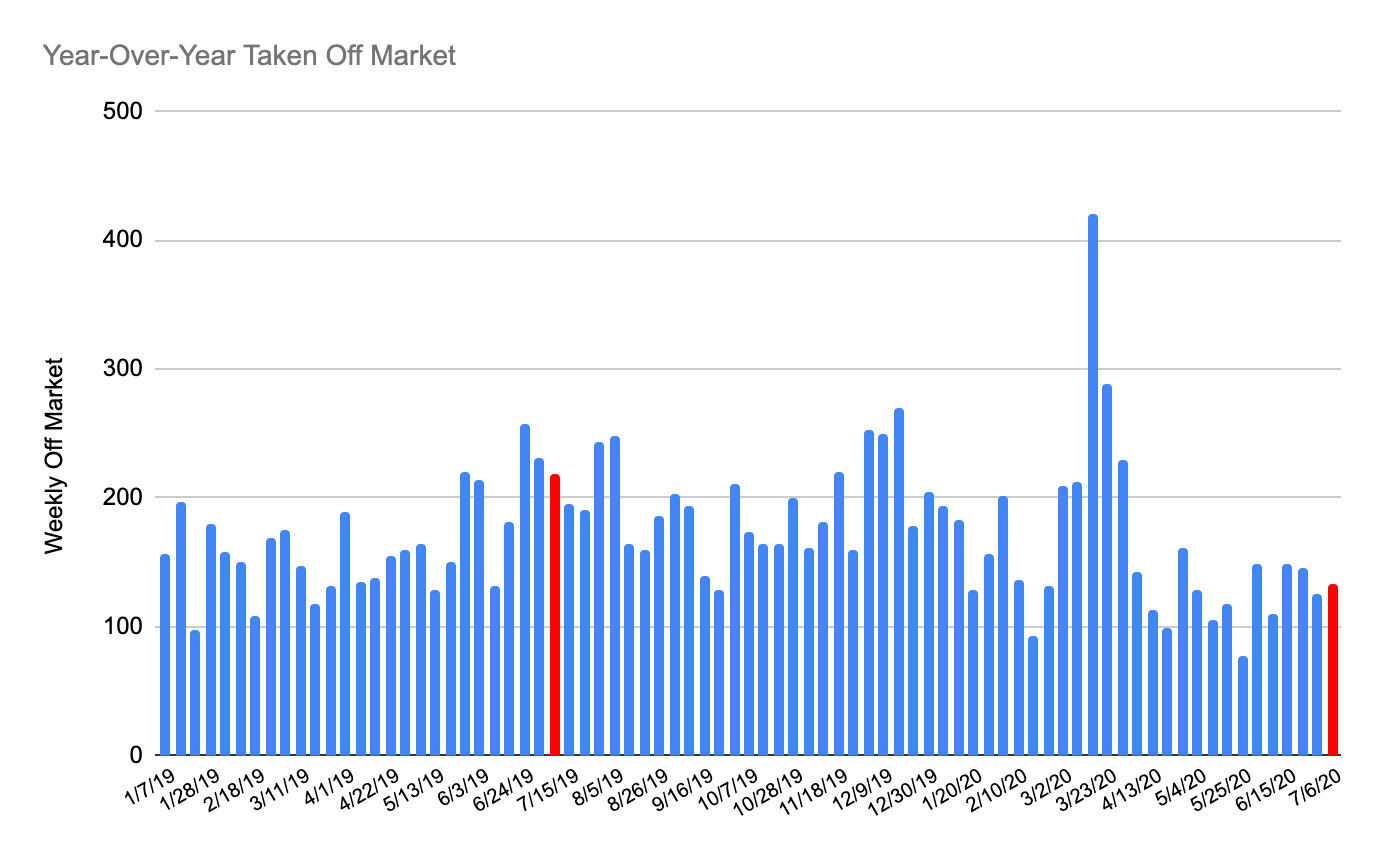
Year-Over-Year Taken Off Market for the 2nd Week of July:
2019: 219
2020: 133 (-39%)