
The story in the rental market remains the mismatch between supply and demand. Last year, the market added approximately 10,000 new rental listings during a busy season that began in June. This year, landlords have added approximately 10% more new listings since June, approximately 11,000 so far, with 60% of those coming after the reopening on June 22. Unfortunately for landlords, the number of leases signed, while up on a week-over-week basis, remains more than 30% below typical seasonal levels.
This is the first period (in UrbanDigs’ bi-weekly measurement) since the start of the pandemic where neither of the most recent weeks, when taken individually, saw a higher number of leases signed than either of the previous two weeks. While this is just one data point and not yet a trend, landlords may be pausing and beginning to worry that leasing at current rent levels has peaked.
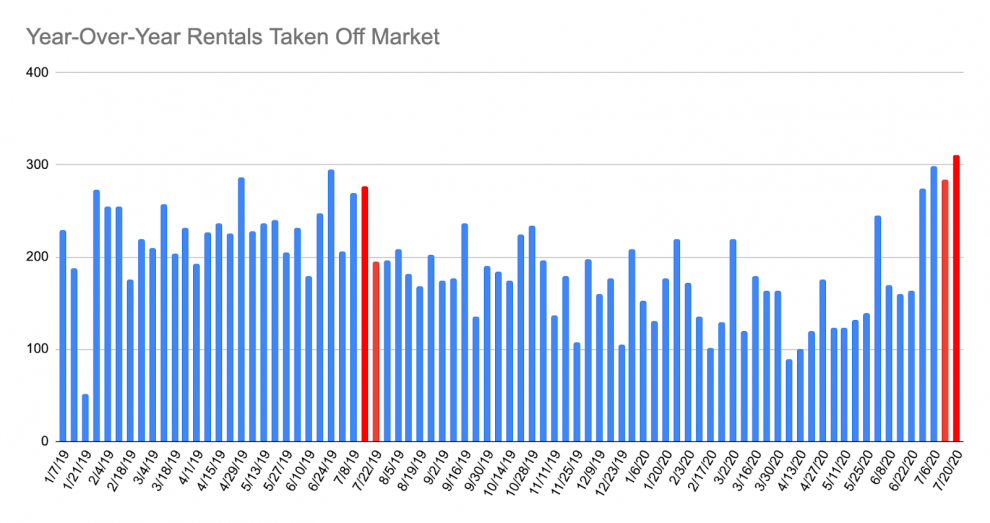
As a result, the market is beginning to see repeated increases in the number of listings removed from the market, as landlords opt for less visible competition. Additionally, while already offering net-effective-based concessions such as free months which keep lease rates high, but with lowered effective monthly costs, landlords appear to finally be responding to the increased supply by also lowering overall rents. A look at the median asking rent for Manhattan suggests a flat to negative trend across rental prices as 2020 progresses. With 2019’s median asking rent dipping after the summer, the question becomes how low will rents need to go to win back tenants?
Year-Over-Year Summary of 3rd/4th Week of July (July 13-July 26) market activity:
- New Rental Listings: 2,752 (an increase of 28% compared to 2,152 in 2019)
- Lease Signed: 1,480 (a decrease of 34% compared to 2,236 in 2019)
- Taken Off Market: 595 (an increase of 26% compared to 472 in 2019)
Week-to-Week Comparing the 3rd/4th Week of July 2020 to the 3rd/4th Week of July 2020 market activity:
- New Rental Listings: 2,752 (a decrease of 12% compared to 3,132 the two weeks before
- Lease Signed: 1,480 (an increase of 15% compared to 1,284 the two weeks before)
- Taken Off Market: 595 (an increase of 4% compared to 573 the two weeks before)
Rentals data source: RLS. Monday to Sunday defines a “week” of data. The weeks of July 13 and July 26 are the 3rd/4th Weeks of July.

YEAR-OVER-YEAR NEW RENTAL LISTINGS

New Listings During the 3rd/4th Week of July:
2019: 2,152
2020: 2,752 (+28%)
YEAR-OVER-YEAR NEW LEASE SIGNED/RENTED

Leases Signed During the 3rd/4th Week of July:
2019: 2,236
2020: 1,480 (-34%)
YEAR-OVER-YEAR RENTALS TAKEN OFF MARKET

Listings Removed During the 3rd/4th Week of July:
2019: 472
2020: 595 (+26%)