
Written by John Walkup of UrbanDigs
Highlights:
-
Pace of new listings remains elevated
-
Highest number of leases signed this year
-
Median rent likely down more than 10%
-
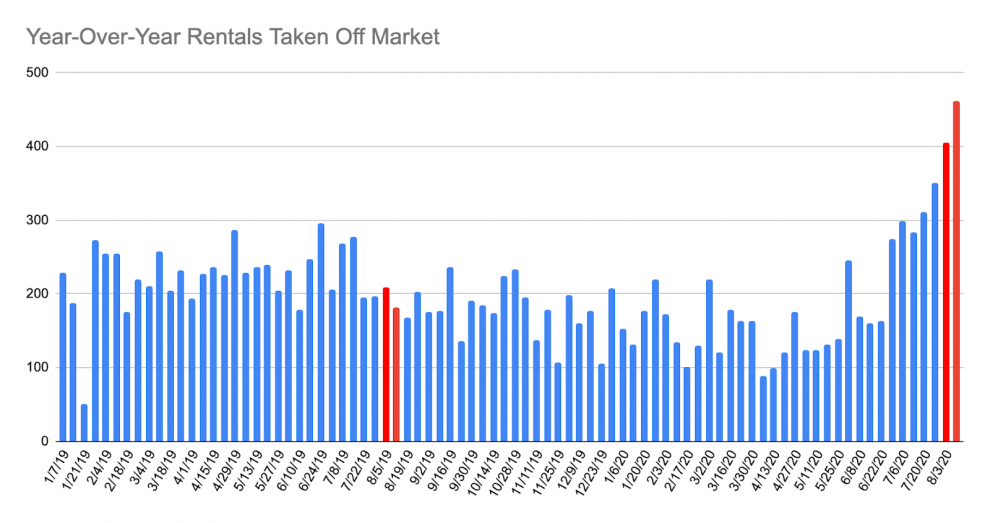
Listings removed from market surge to three-year highs
The big story in the rental market remains the mismatch between supply and demand. On the supply side, as noted in prior reports, there are approximately 16% more new rental listings this year compared to last year, with the majority hitting the market post-reopening. The last two weeks were no exception, with another 2,908 listings added. On the demand side, the pandemic crimped leasing activity by nearly 25% from July through August, leading to an apparent supply glut. In turn, the median asking rent over that period has dropped by nearly 7% which, because most final lease prices are not reported, hints that actual lease rates are likely down more than 10% from their year-ago rates.
These noticeable lower rents helped push the number of signed leases up 9% from the prior two-week period, suggesting that previously reluctant tenants are sensitive to deals. At the same time, the number of listings removed from the market spiked to its highest level in three years as landlords continue to grapple with oversupply by culling listings. While it remains to be seen if this increase in leasing activity is sustainable, it perhaps begins to answer the overriding question: how low will rents need to go to win back tenants as the traditional active season winds down?
Year-Over-Year Summary of 1st/2nd Week of August (August 3-August 16) market activity:
-
New Rental Listings: 2,908 (an increase of 34% compared to 2,180 in 2019)
-
Lease Signed: 1,730 (a decrease of 4% compared to 1,800 in 2019)
-
Taken Off Market: 868 (an increase of 122% compared to 391 in 2019)
Week-to-Week Comparing the 1st/2nd Week of August 2020 to the 4th/5th Week of July 2020 market activity:
-
New Rental Listings: 2,908 (a decrease of 0.3% compared to 2,918 the two weeks before)
-
Lease Signed: 1,730 (an increase of 9% compared to 1,594 the two weeks before)
-
Taken Off Market: 868 (an increase of 31% compared to 661 the two weeks before)
Rentals data source: RLS. Monday to Sunday defines a “week” of data. The weeks of August 3 and August 10 are the 1st/2nd Weeks of August.

YEAR-OVER-YEAR NEW RENTAL LISTINGS

The four red bars are the two-week values displayed under each chart: 1st/2nd Week August in 2019 and 1st/2nd Week August in 2020.
New Listings During the 1st/2nd Week August:
2019: 2,180
2020: 2,908 (+34%)
YEAR-OVER-YEAR NEW LEASE SIGNED/RENTED

The four red bars are the two-week values displayed under each chart: 1st/2nd Week August in 2019 and 1st/2nd Week August in 2020.
Leases Signed During the 1st/2nd Week August:
2019: 1,800
2020: 1,730 (-4%)
YEAR-OVER-YEAR RENTALS TAKEN OFF MARKET

The four red bars are the two-week values displayed under each chart: 1st/2nd Week August in 2019 and 1st/2nd Week August in 2020.
Listings Removed During the 1st/2nd Week August:
2019: 391
2020: 868 (+122%)