
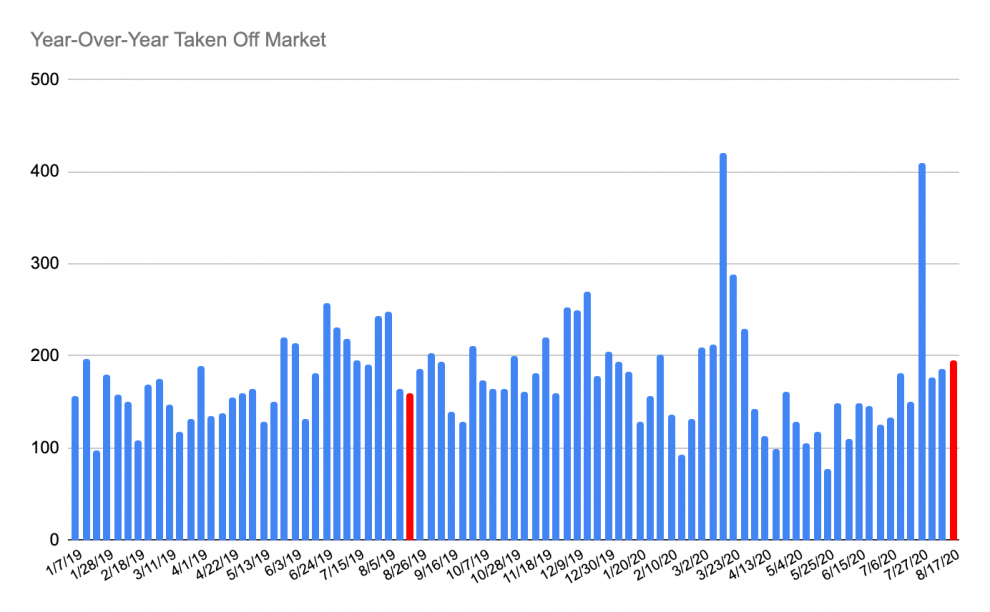
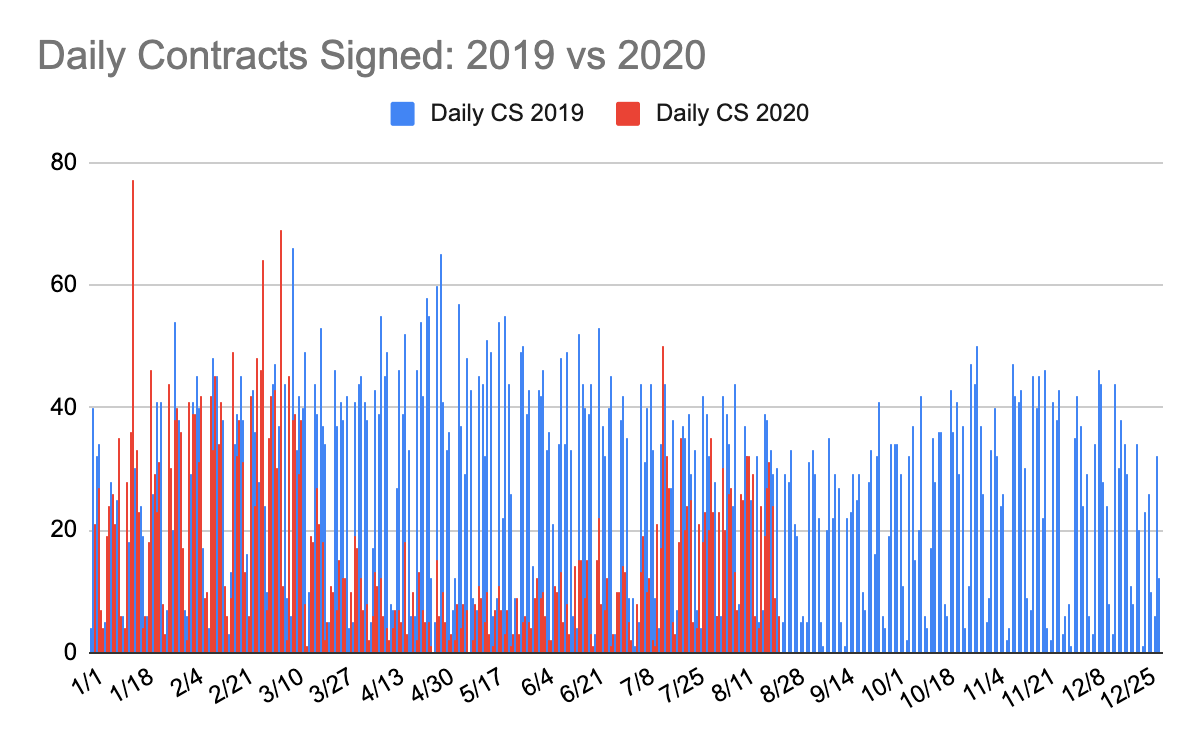
As mentioned previously, the Manhattan real estate market remains range-bound in a new normal. Continuing the trend from last week, the number of weekly new active sales listings declined for the third straight week. The 140 contracts signed last week was five shy of the running 6-week average. Finally, the number of listings removed from the market crept up 5% from the previous week, hinting that sellers remain ambivalent about market conditions, not panicked.
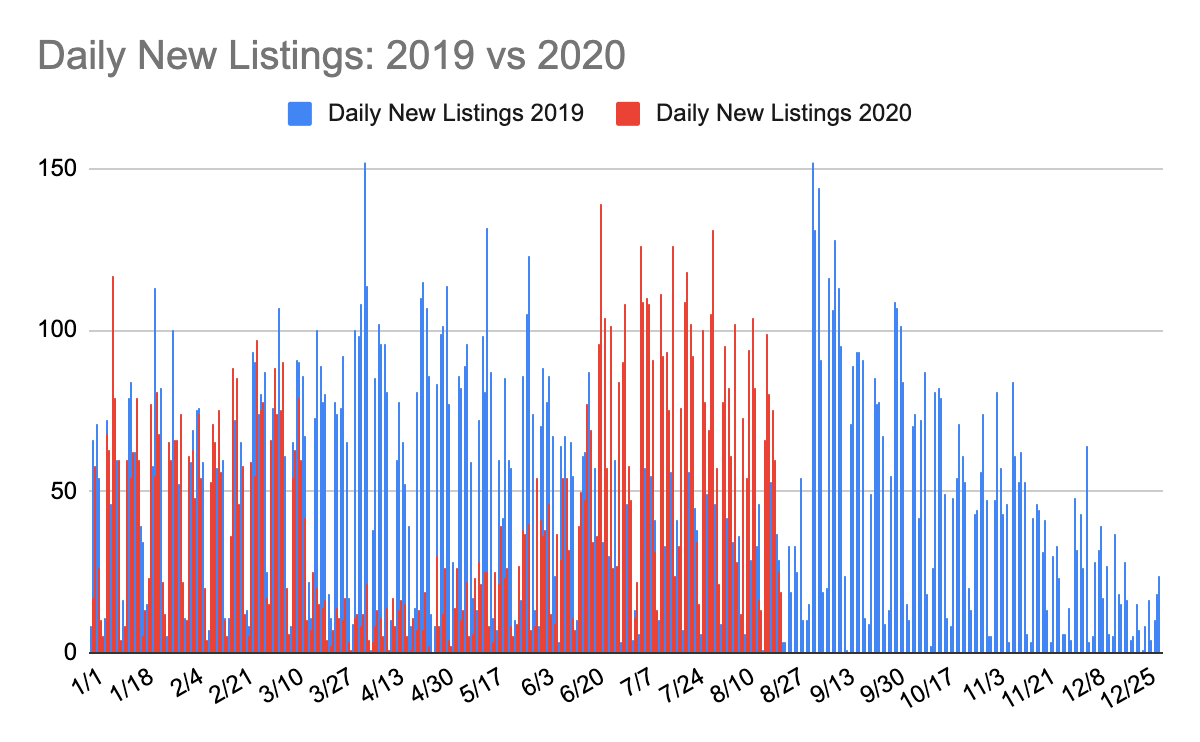
Weekly declines in both new listings and contracts signed suggest that with the arrival of late August, traditionally the slowest time of year, the market appears to be following the well-worn path of winding down for a summer break. Activity typically remains sluggish during the final weeks of August and through Labor Day, when a fresh batch of new listings usually hit the market after having ebbed since June. This year, however, the market reopening in late June pushed the “busy” season later into the summer. And while the number of new listings has certainly decreased over the last several weeks, the number added remains double the usually languid pace of August. This suggests that for those who are willing to brave the heat, humidity, and macroeconomic conditions, it is, as one Manhattan agent says, “A buyers market on steroids”.
Year-over-Year Summary of 3rd Week of August 2020 (Monday 8/17/20 – Sunday 8/23/20) market activity:
- New Listings: 424 (an increase of 114% compared to 198 in 2019)
- Contracts Signed: 140 (a decrease of 21% compared to 177 in 2019)
- Taken Off Market: 195 (an increase of 23% compared to 159 in 2019)
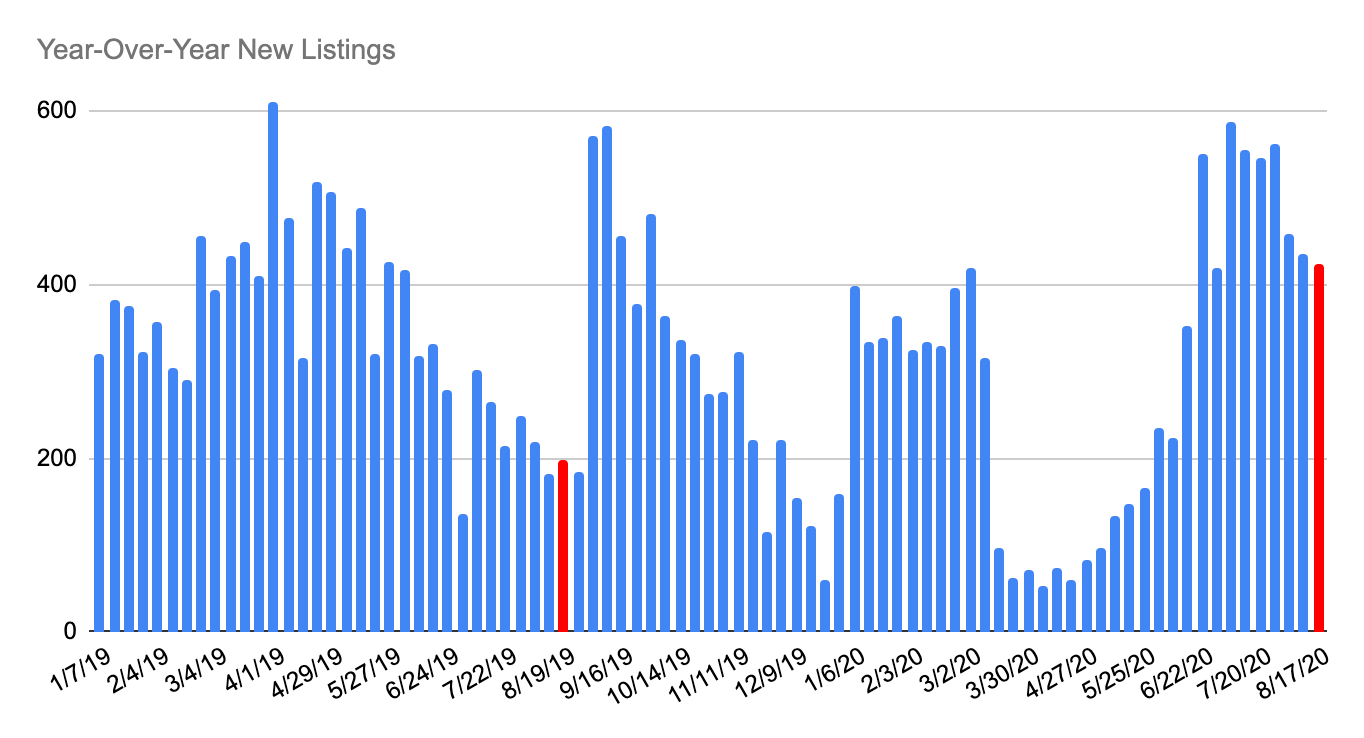
Year-Over-Year New Listings for the 3rd week of August:The two red bars are the two values displayed under each chart: 3rd week of August in 2019 and 3rd week of August in 2020
2019: 198
2020: 424 (+114%)
The two red bars are the two values displayed under each chart: 3rd week of August in 2019 and 3rd week of August in 2020
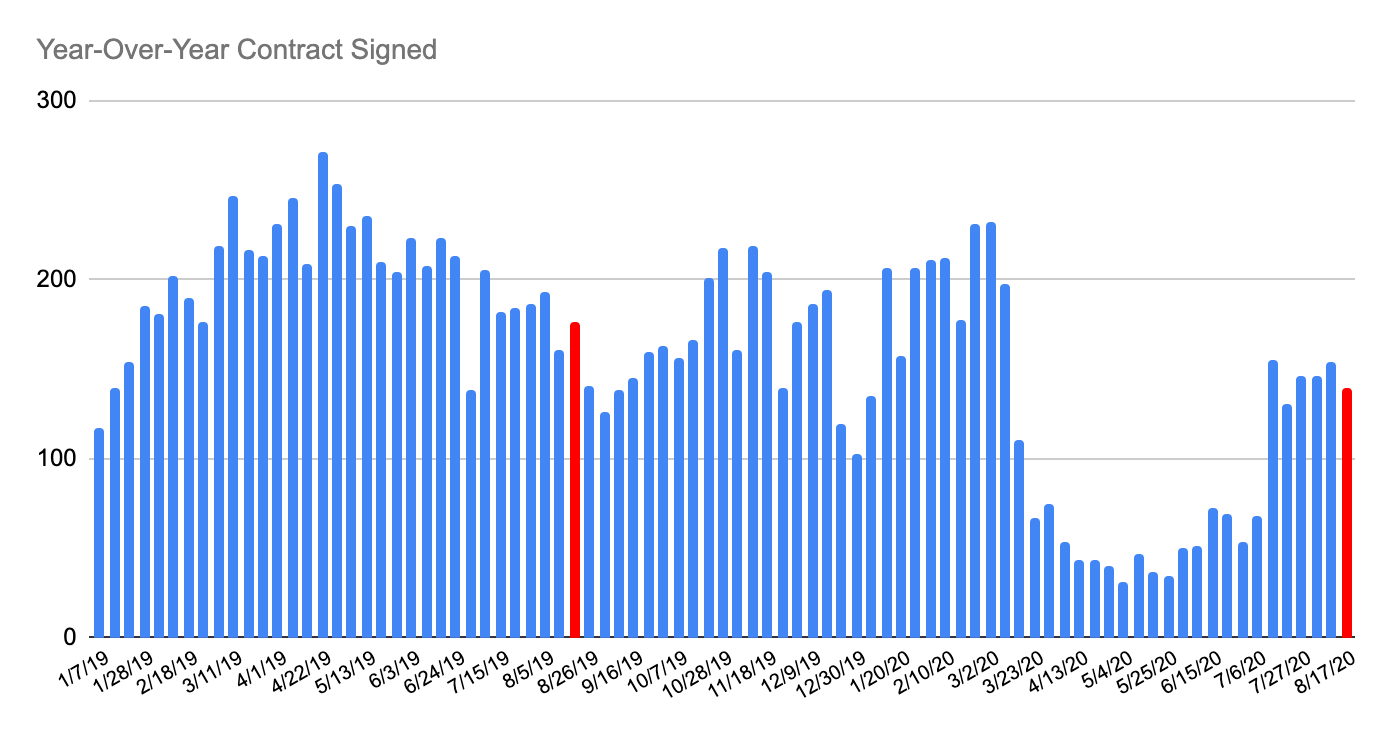
Year-Over-Year Contracts Signed for the 3rd week of August:
2019: 177
2020: 140 (-21%)
The two red bars are the two values displayed under each chart: 3rd week of August in 2019 and 3rd week of August in 2020
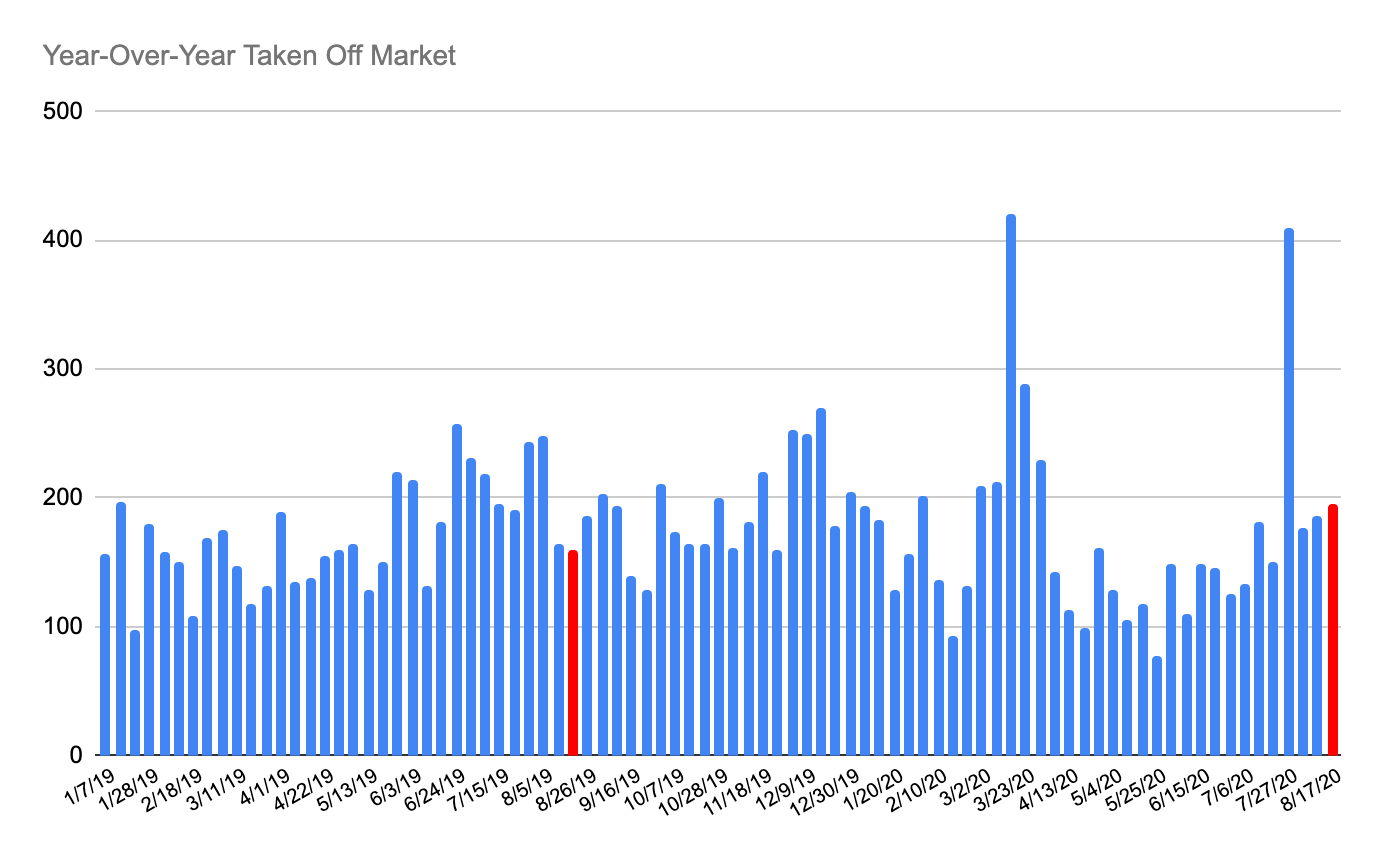
Year-Over-Year Taken Off Market for the 3rd week of August:
2019: 159
2020: 195 (+23%)