
Highlights:
-
There were fewer new listings last month than in July, but a record-high for August (-24% month-over-month and 108% year-over-year)
-
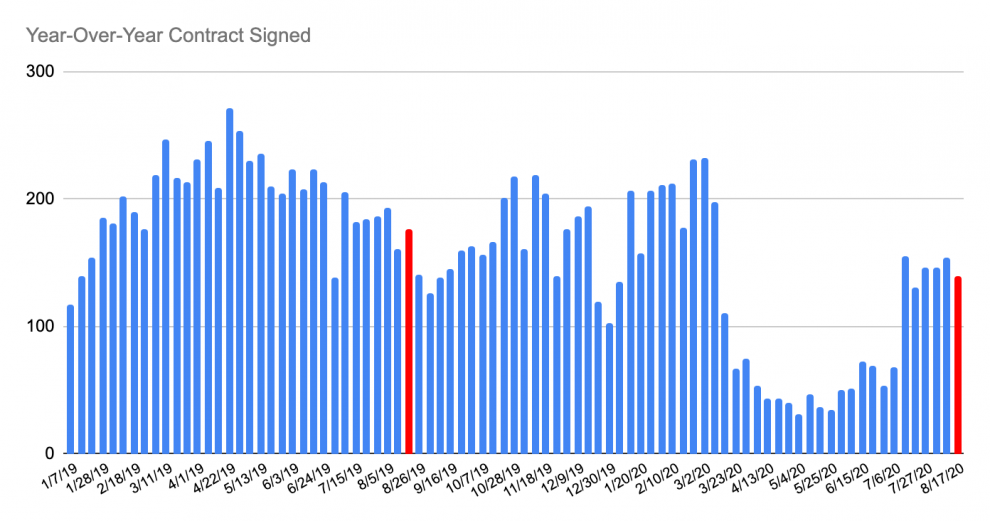
Contracts signed activity was up 25% from July, but still down 16% year-over-year
-
There was a 7% median listing discount for deals signed and closed in August
August is generally considered to be the slowest month of the year in the real estate industry, as buyers, sellers, and everyone in between tries to sneak in a late-summer vacation. That’s not the case this year, however, as last month saw the second-busiest month for new listings in 2020, and the highest number of contracts signed since April. While the number of signed contracts increased for the third straight month, the overall number of deals made during August suggests that buyers are still proceeding with caution: The number of contracts signed was down 16% from August 2019.
On the bright side, there were a slew of new listings that hit the market last month. August’s 1,827 new listings, while down 24% from July, set an August record for new inventory. The number of new listings is on a clear upward trajectory, which may lead to price fluctuations as sellers in Manhattan are forced to compete over a relatively small pool of buyers.
And there’s more good news for potential buyers, too: The number of listings removed from the market, after rising in July, decreased during August to typical seasonal levels. That suggests that sellers remaining on the market will be more likely to cut prices in the coming weeks or months.
In a slice of good news for sellers, the data shows that the median listing discount for deals peaked during the COVID shutdown in April and June near 10%. While buyers continue to have the upper hand, listing discounts have receded down to 7.4%, roughly where they were in August 2019, meaning that the market may be adjusting to a new, post-pandemic normal.
As mentioned in previous reports and on our podcast, “Talking Manhattan”, a closer look at recent contracts signed by price point shows that the majority of market activity is in the sub $2M sector, suggesting that the bulk of today’s buyers have a need or a want to remain in the city.
Year-over-Year Summary for August (August 2020 vs August 2019) market activity:
-
New Listings: 1,827 (an increase of 108% compared to 880 in 2019)
-
Contracts Signed: 619 (a decrease of 16% compared to 740 in 2019)
-
Taken Off Market: 761 (a decrease of 11% compared to 856 in 2019)

The two red bars are the two values displayed under each chart: August 2019 and August 2020
Year-Over-Year New Listings for the Month of August:
2019: 880
2020: 1,827 (+108%)

The two red bars are the two values displayed under each chart: August 2019 and August 2020
Year-Over-Year Contracts Signed for the Month of August:
2019: 740
2020: 619 (-16%)

The two red bars are the two values displayed under each chart: August 2019 and August 2020
Year-Over-Year Taken Off Market for the Month of August:
2019: 856
2020: 761 (-11%)

The two red bars are the two values displayed under each chart: August 2019 and August 2020
Listing Discount for Contracts Signed in the Month of August:
2019: 7.3%
2020: 7.4%

Manhattan Rental Market:
Highlights:
-
The number of new rental listings increased in August, but the pace slowing (+31% year-over-year and -13% month-over-month)
-
Lease signed activity improving, but still low (+23% month-over-month and -8% year-over-year)
-
Manhattan median rent lowest since September 2019 (-3% month-over-month and +3% year-over-year)
Landlords remained under intense pressure during August, as vacancies piled up and there were a fewer number of tenants to fill them. But a 13% drop in new rental listings month-to-month, combined with a 23% increase in lease signings, is an indication that the tide may be turning. Median rents for Manhattan decreased 3% from July to their lowest level since September 2019 as landlords have been able to catch prospective tenants’ attention with lower prices. But now, as the summer winds down and the fall season, which is typically slower, gets underway, the imbalance between supply and demand may force landlords to make deeper concessions and steeper discounts as competition for tenants grows fiercer.
Year-Over-Year Summary for August (2019 vs 2020) market activity:
-
New Rental Listings: 5,835 (an increase of 31% compared to 4,442 in 2019)
-
Lease Signed: 3,812 (a decrease of 8% compared to 4,130 in 2019)
-
Off-Market: 1,958 (an increase of 128% compared to 857 in 2019)
Rentals data source: RLS.
YEAR-OVER-YEAR NEW RENTAL LISTINGS

The two red bars are the monthly values displayed under each chart: August 2019 and August 2020.
New Listings During the Month of August:
2019: 4,442
2020: 5,835 (+31%)
YEAR-OVER-YEAR NEW LEASE SIGNED/RENTED

The two red bars are the monthly values displayed under each chart: August 2019 and August 2020.
Leases Signed During the Month of August:
2019: 4,130
2020: 3,812 (-8%)
YEAR-OVER-YEAR RENTALS TAKEN OFF MARKET

The two red bars are the monthly values displayed under each chart: August 2019 and August 2020.
Listings Removed During the Month of August:
2019: 857
2020: 1,958 (+128%)

The two red bars are the monthly values displayed under each chart: August 2019 and August 2020.
Median Asking Rent for August:
2019: $3,350
2020: $3,450 (+3%)