
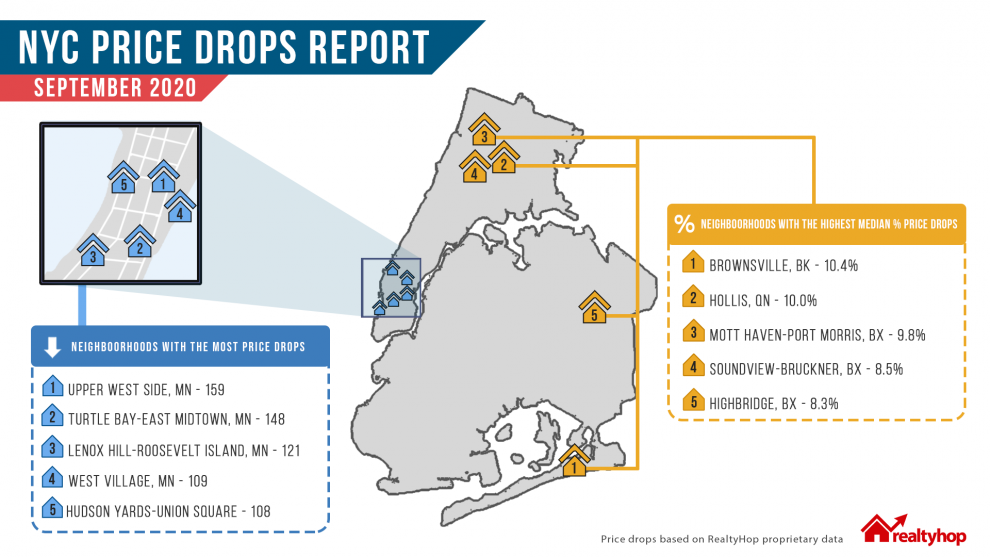
The real estate market has its ups and downs. In September’s monthly price drop report, RealtyHop analyzed available data for August across boroughs and neighborhoods in New York City to provide a useful resource for those looking to invest in real estate.We specifically focused on neighborhoods with the highest total number of price drops, specifically the highest price drops by median percentage, median dollar value, and by street address.
A Closer Look at NYC’s Neighborhoods
Our interactive map below depicts the neighborhoods we analyzed. All numbers are based on RealtyHop’s proprietary dataset.
Top 5 Neighborhoods With the Highest Number of Price Drops
| Neighborhood | Borough | Number of Price Drops | |
| 1 | Upper West Side | Manhattan | 159 |
| 2 | Turtle Bay-East Midtown | Manhattan | 148 |
| 3 | Lenox Hill-Roosevelt Island | Manhattan | 121 |
| 4 | West Village | Manhattan | 109 |
| 5 | Hudson Yards-Chelsea-Flatiron-Union Square | Manhattan | 108 |
COVID-19 has greatly impacted the NYC sales market in many ways. After months of lackluster performances, we are once again seeing activities. While inventory is returning to the market, there seems to be a huge gap between the asking price and what buyers are willing to offer.In both July and August, we saw an uptick in the number of sales listings, and compared to July, the number of price drops in New York City didn’t fluctuate much this past month. When comparing to August 2019, we noticed that there were significantly more price reductions this summer. Upper West Side, for instance, saw only 76 price drops in August 2019. This number jumped to 159 in August 2020, a 109% increase. Below are the top fice neighborhoods that saw the most price drops. The neighborhoods on the list had a total number of price drops ranging from 116 to 158 price drops.
Top 5 Neighborhoods With the Highest Median Percentage Price Drops
| Neighborhood | Borough | Median % Price Drops | |
| 1 | Brownsville | Brooklyn | -10.4% (-$122,000) |
| 2 | Hollis | Queens | -10.0% (-$180,000) |
| 3 | Mott Haven-Port Morris | Bronx | -9.8% (-$65,100) |
| 4 | Soundview-Bruckner | Bronx | -8.5% (-$36,000) |
| 5 | Highbridge | Bronx | -8.3% (-$34,500) |
| Neighborhood | Borough | Median $ Price Drops | |
| 1 | Hollis | Queens | -$180,000 (-8.5%) |
| 2 | SoHo-TriBeCa-Civic Center-Little Italy | Manhattan | -$145,000 (-5.2%) |
| 3 | Brownsville | Brooklyn | -$122,000 (-10.4%) |
| 4 | Upper East Side-Carnegie Hill | Manhattan | -$99,750 (-5.9%) |
| 5 | DUMBO-Vinegar Hill-Downtown Brooklyn-Boerum Hill | Brooklyn | -$80,000 (-5.1%) |
Top 5 Addresses (Still on the Market) with the Highest Percentage Price Drop in August
| Address | Current Price | Recent % Price Drops | |
| 1 | 150 Central Park S, Manhattan, NY 10019 | $8,000,000 | -50.0% (-$7,990,000) |
| 2 | 645 E 26th St, Brooklyn, NY 11210 | $445,000 | -31.0% (-$200,000) |
| 3 | 1600 Broadway, Manhattan, NY 10019 | $1,400,000 | -29.8% (-$595,000) |
| 4 | 21-77 33rd Street, Queens, NY 11105 | $350,000 | -29.2% (-$145,000) |
| 5 | 1399 Park Ave, Manhattan, NY 10029 | $2,995,000 | -27.0% (-$1,105,000) |
Top 5 Addresses (Still on the Market) with the Highest Dollar Price Drop in August
| Address | Current Price | Recent $ Price Drops | |
| 1 | 150 Central Park S, Manhattan, NY 10019 | $8,000,000 | -$7,999,999 (-50.0%) |
| 2 | 50 Central Park S, Manhattan, NY 10019 | $21,000,000 | -$4,000,000 (-16.0%) |
| 3 | 12 E 80th St, Manhattan, NY 10021 | $21,800,000 | -$3,200,000 (-12.8%) |
| 4 | 860 Fifth Avenue, Manhattan, NY 10065 | $11,999,000 | -$2,951,000 (-19.7%) |
| 5 | 15 Central Park W, Manhattan, NY 10023 | $13,788,000 | -$2,112,000 (-13.3%) |
The New York City Price Drop report is a monthly report that analyzes proprietary data from RealtyHop to map price drops for listings in New York City. The dataset analyzed is taken from the month prior to publication and includes all five boroughs of New York City, given sufficient data.
Want to know who owns these listings? Check it out for yourself on our site by using our New York Property Records Search.